918 B
Visual File History

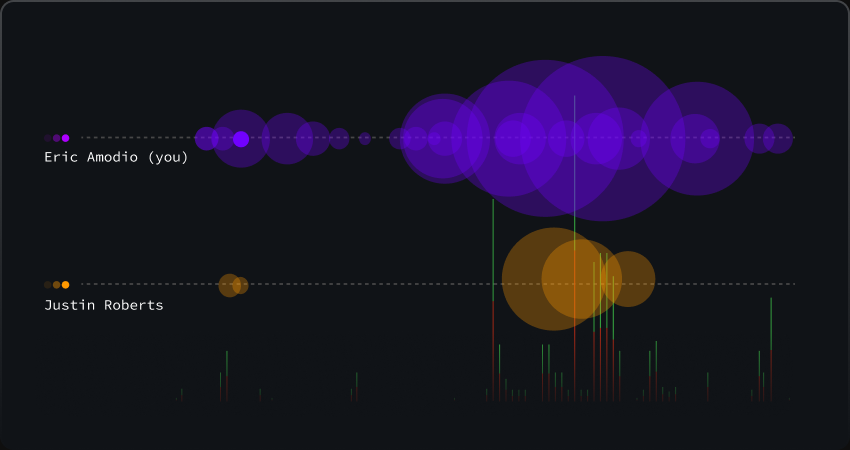
The Visual File History allows you to quickly see the evolution of a file, including when changes were made, how large they were, and who made them.
Use it to quickly find when the most impactful changes were made to a file or who best to talk to about file changes, and more.
Authors who have contributed changes to the file are on the left y-axis to create a swim-lane of their commits over time (the x-axis). Commit are plotted as color-coded (per-author) bubbles, whose size represents the relative magnitude of the changes.
Additionally, each commit's additions and deletions are visualized as color-coded, stacked, vertical bars, whose height represents the number of affected lines (right y-axis). Added lines are shown in green, while deleted lines are red.
